Biocorpora provides unique decision-support and data management tools for researchers working in drug discovery. Biological results are imported into the database as structured items that are used to index, or group data and to calculate averages and built report tables.
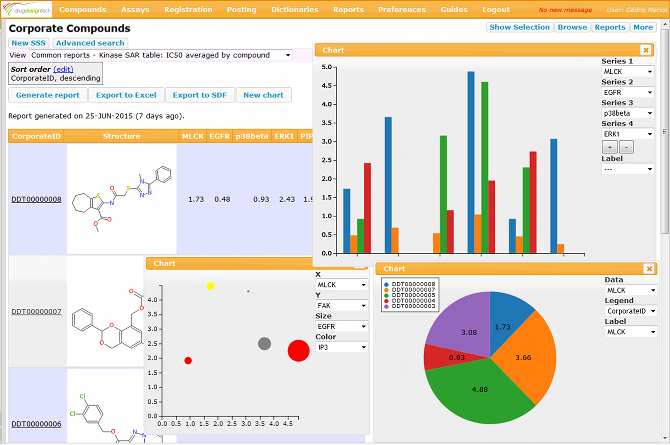
Results can then be integrated into powerful charts. Using visual representations to show data makes them easier to understand. Charts shorten vaste amounts of data into easy-to-read and concise representations. You can decide what kind of graphs best illustrates your data (pie charts, bar graphs, scatterplots…) and can be used for adding visual appeal to show a trend in data relationship or to easily compare two or more data sets.
Learn more about Biocorpora, contact us.